01
Context
The data consists of 3D volumes of human and murine brains acquired by microscopy and stored in TIFF format. These volumes combine noise, intensity variations, and large size — a demanding setting for reliable detection of cell centers. The goal was to improve this detection and build a reproducible experimentation pipeline to compare results.
02
Detection pipeline
The final pipeline chains several complementary steps, from the raw volume to the detected cell centers.
- Volume preprocessing
- Splitting into overlapping sub-volumes
- Adaptive thresholding and candidate seed generation
- Weighted Mean Shift clustering
- Merging detected centers across the full volume
- Optional morphological post-processing
03
Preprocessing and scaling
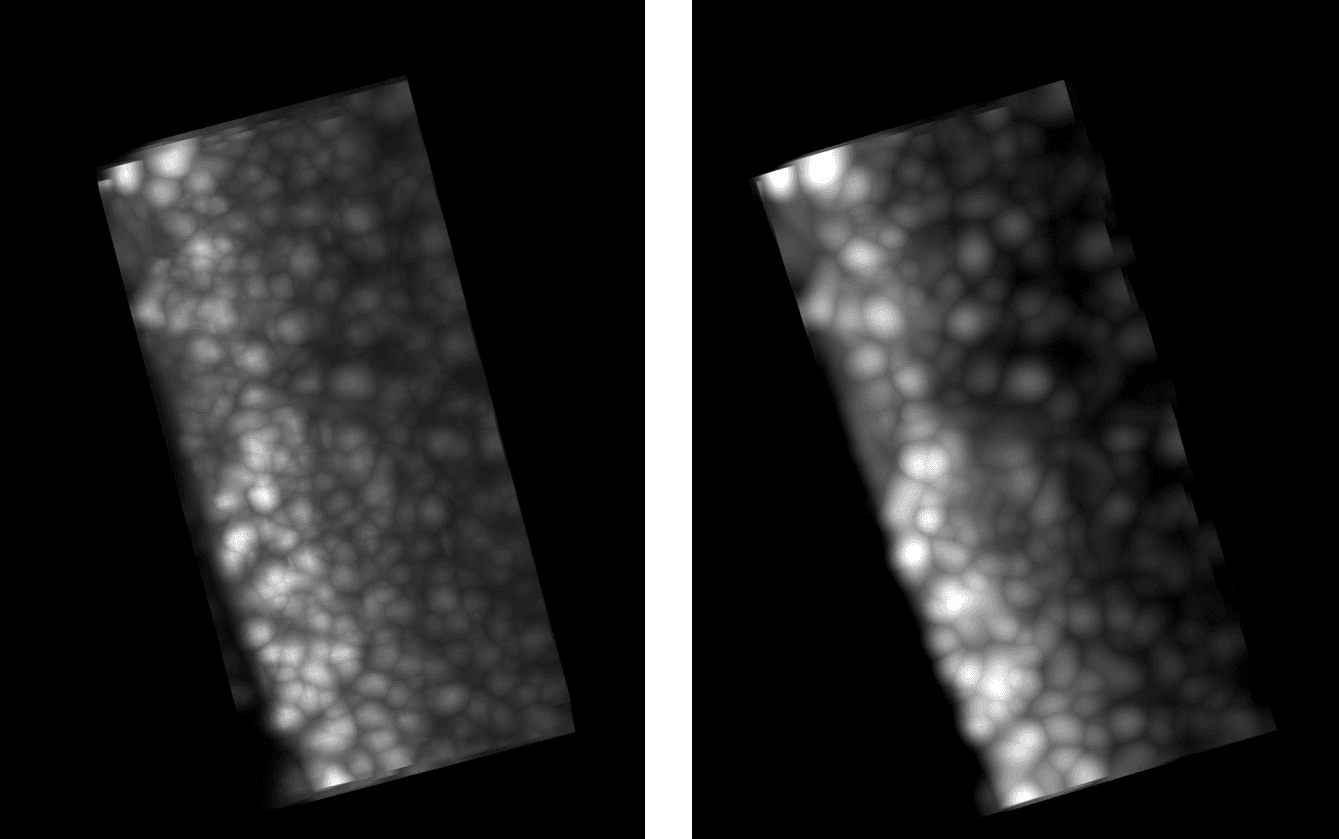
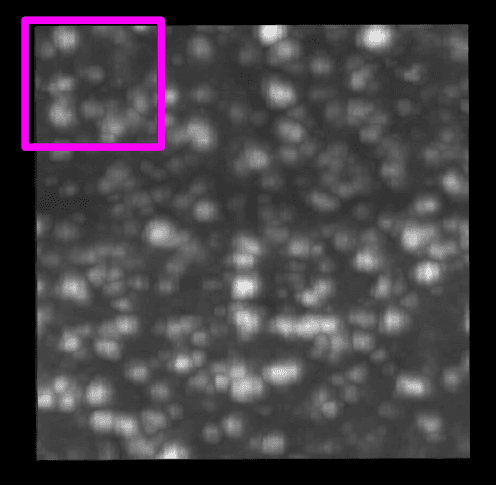
An initial direct implementation gave correct results on simple synthetic volumes but became too costly on real biological volumes. Preprocessing combines filtering and noise reduction; the volume is then split into overlapping sub-volumes, which reduces memory usage, allows blocks to be processed independently, and avoids losing cells sitting at the boundary between two sub-volumes. Some costly steps were parallelized to speed up experimentation.
04
Weighted Mean Shift
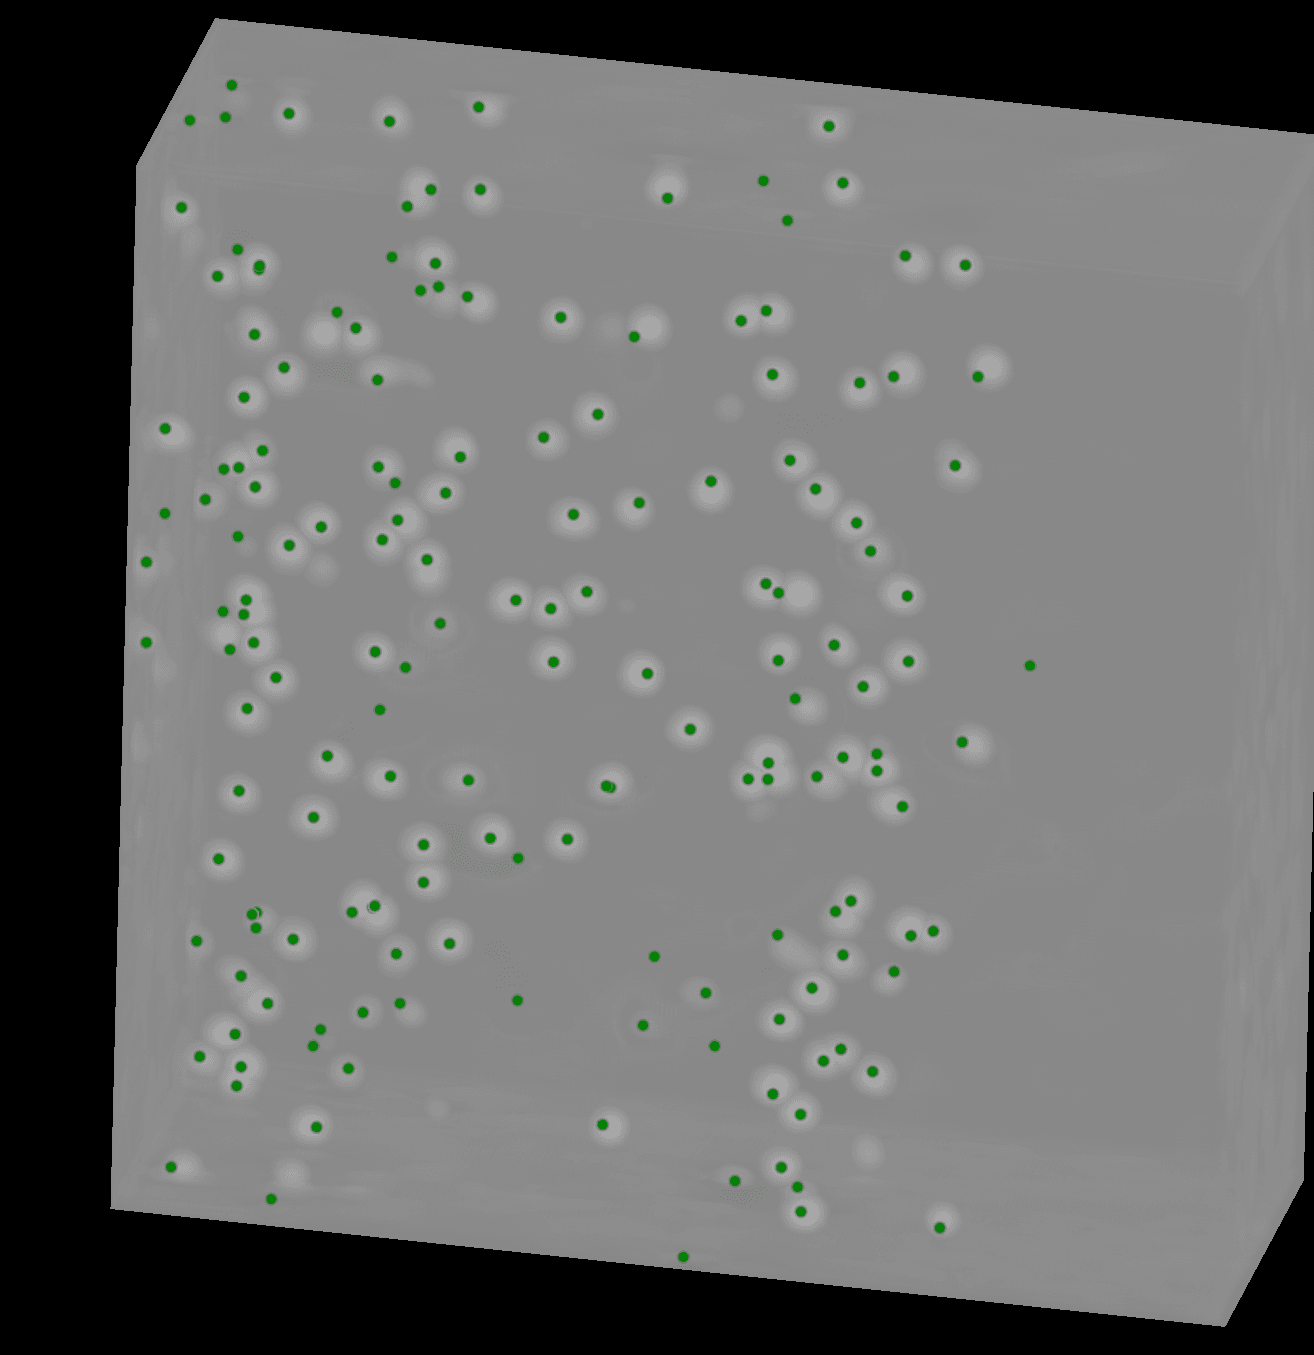
Starting from the candidate points, each point is iteratively shifted toward the center of mass of its local neighborhood, weighted by the intensity of surrounding voxels, until it converges on a high-density region. Centers close enough to each other are then merged into a single cell center.
05
Napari interface
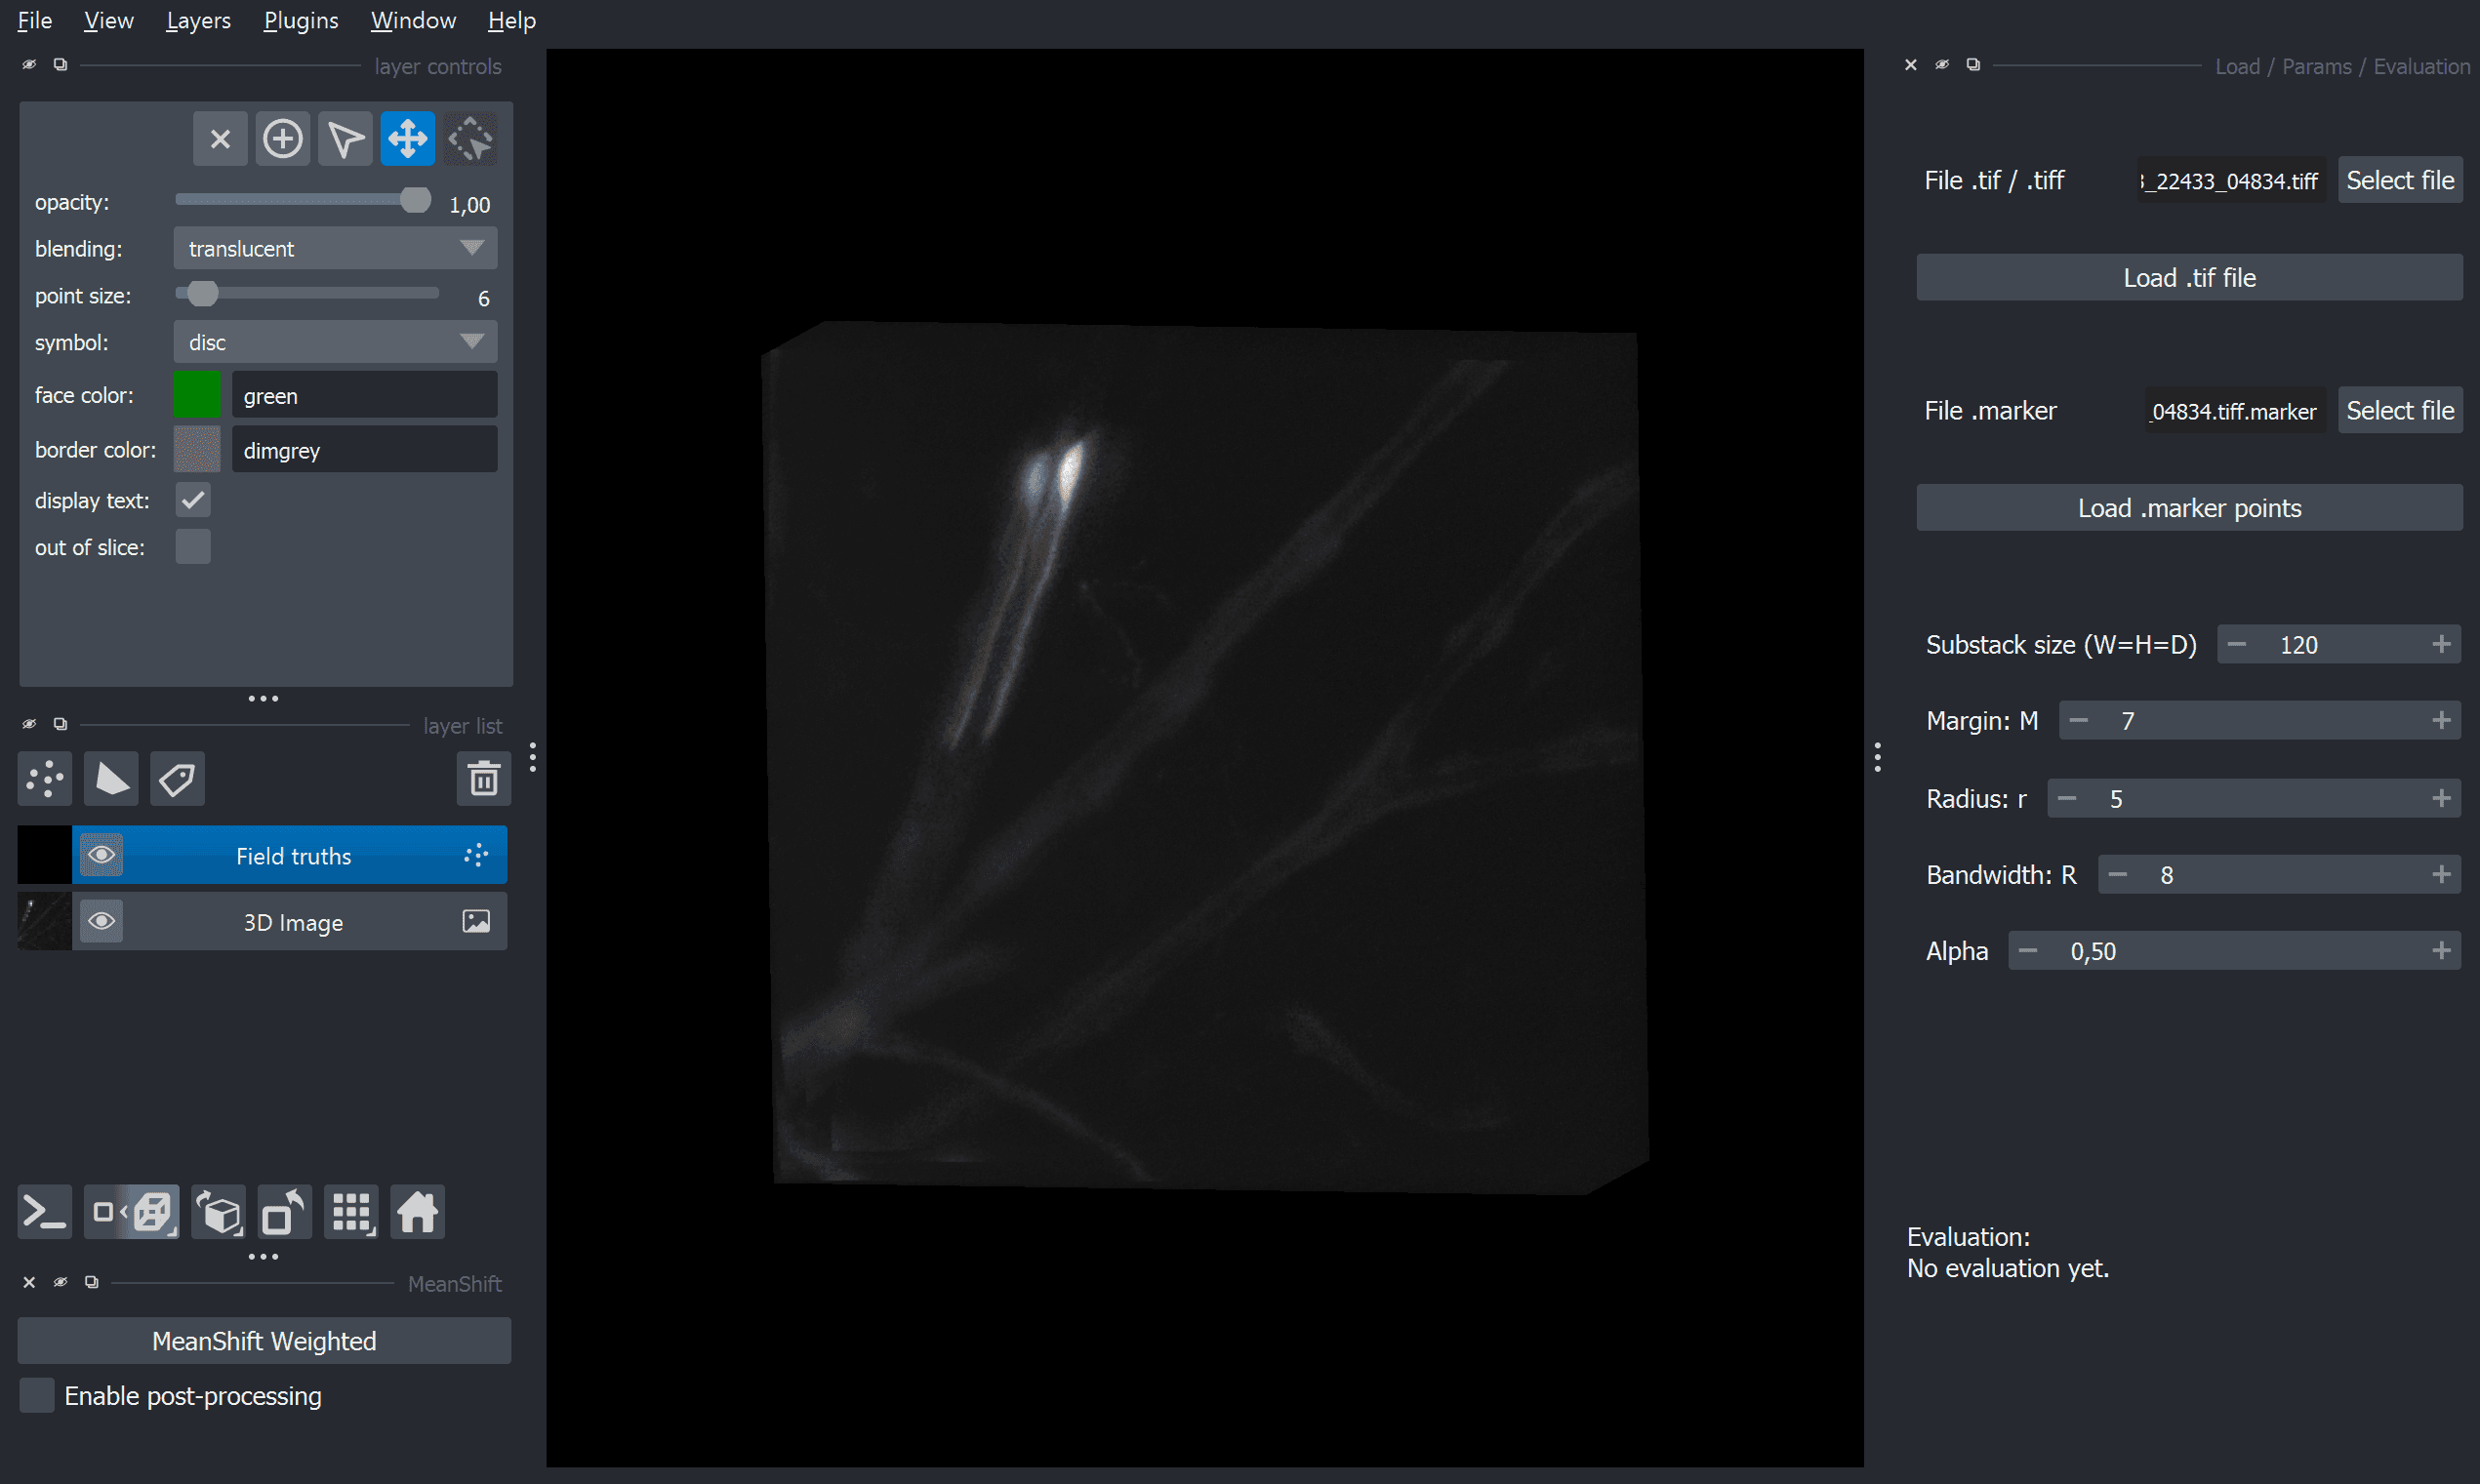
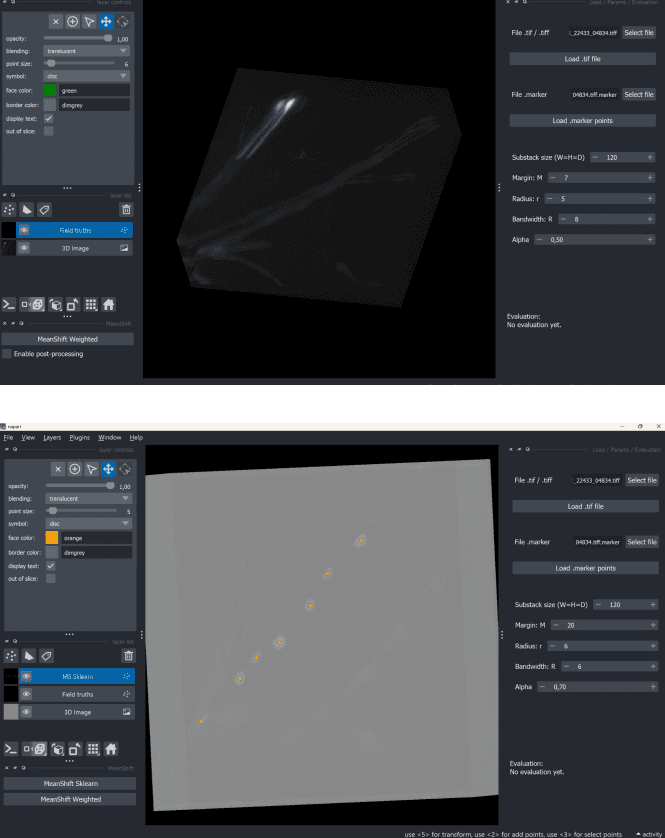
An interactive interface built with Napari brings the pipeline together into a visually operable tool, serving at once as a visualization, analysis, and experimental validation tool.
- Loading a 3D volume and its reference annotations
- Adjusting detection parameters
- Running the full pipeline, with optional post-processing
- Visualizing detected centers within the volume, distinguishing true positives, false positives, and false negatives
- Displaying evaluation metrics and saving detected centers
06
Grid search and evaluation
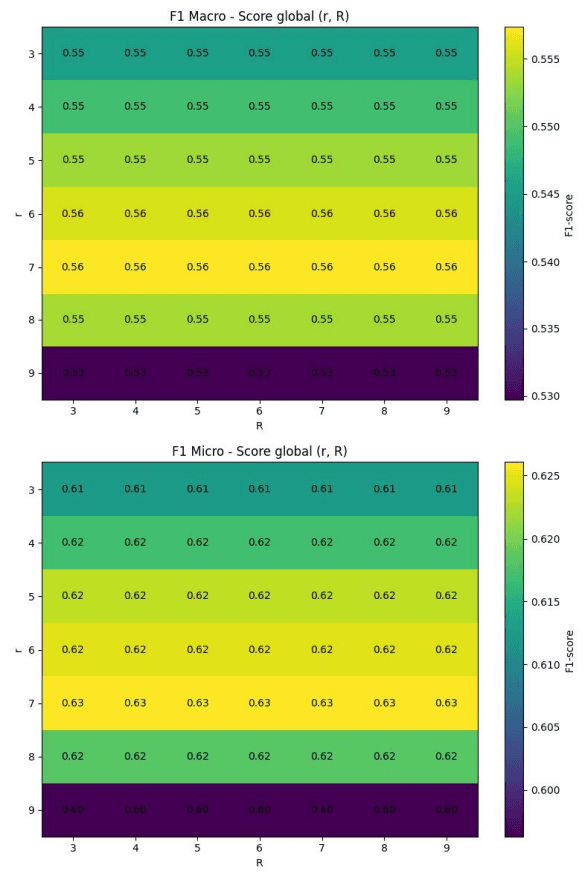
A grid search explores the influence of the main weighted Mean Shift parameters. Each configuration is evaluated by precision, recall, and F1, with heatmaps generated to compare results on a single volume or across a full set of volumes.
- F1 Macro — average of per-volume F1 scores
- F1 Micro — global computation from cumulative true positives, false positives, and false negatives
07
Automation
A complementary approach uses a multi-output Random Forest regression model to automatically predict the pipeline’s parameters from features extracted from the volumes, reducing manual tuning and improving detection reproducibility.
- Grid search to produce reference configurations
- Automatic feature extraction from the volumes
- Training a multi-output Random Forest model
- Predicting parameters and running the full pipeline
- Automatic evaluation of results
08
Experimental limits
Metrics should not be interpreted independently of ground-truth quality. Some reference annotations are not perfectly aligned with the processed volumes, which can artificially penalize precision, recall, and F1 even when detections remain visually consistent with the observed structures. This limitation led to keeping both a quantitative and a visual analysis of the results.
09
End-to-end chain
The pipeline links 3D image processing, clustering, parameter optimization, machine learning, interactive visualization, and evaluation into a single experimental chain. It allows different cell-center detection strategies on 3D biomedical volumes to be explored, compared, and automated.